13 Plot others
In this part, we will introduce plotVenn and plotVolcano.
13.1 Venn Plot
Venn plot needs a list of gene sets, for example:
set1 <- paste0(rep("gene", 50), sample(1:1000, 50))
set2 <- paste0(rep("gene", 60), sample(1:1000, 60))
set3 <- paste0(rep("gene", 70), sample(1:1000, 70))
set4 <- paste0(rep("gene", 80), sample(1:1000, 80))
set5 <- paste0(rep("gene", 100), sample(1:1000, 100))

# three groups
sm_gene_list <- list(gset1 = set1, gset2 = set2, gset3 = set3)

# five groups
la_gene_list <- list(
  gset1 = set1, gset2 = set2, gset3 = set3,
  gset4 = set4, gset5 = set5
)
plotVenn supports two types: Venn (default) and UpSet. Besides, it also supports modification of text size, alpha degree, colors and other parameters from plot_theme.
plotVenn(sm_gene_list,
         use_venn = TRUE,
         color = ggsci::pal_lancet()(3),
         alpha_degree = 1,
         main_text_size = 1.5,
         border_thick = 0
)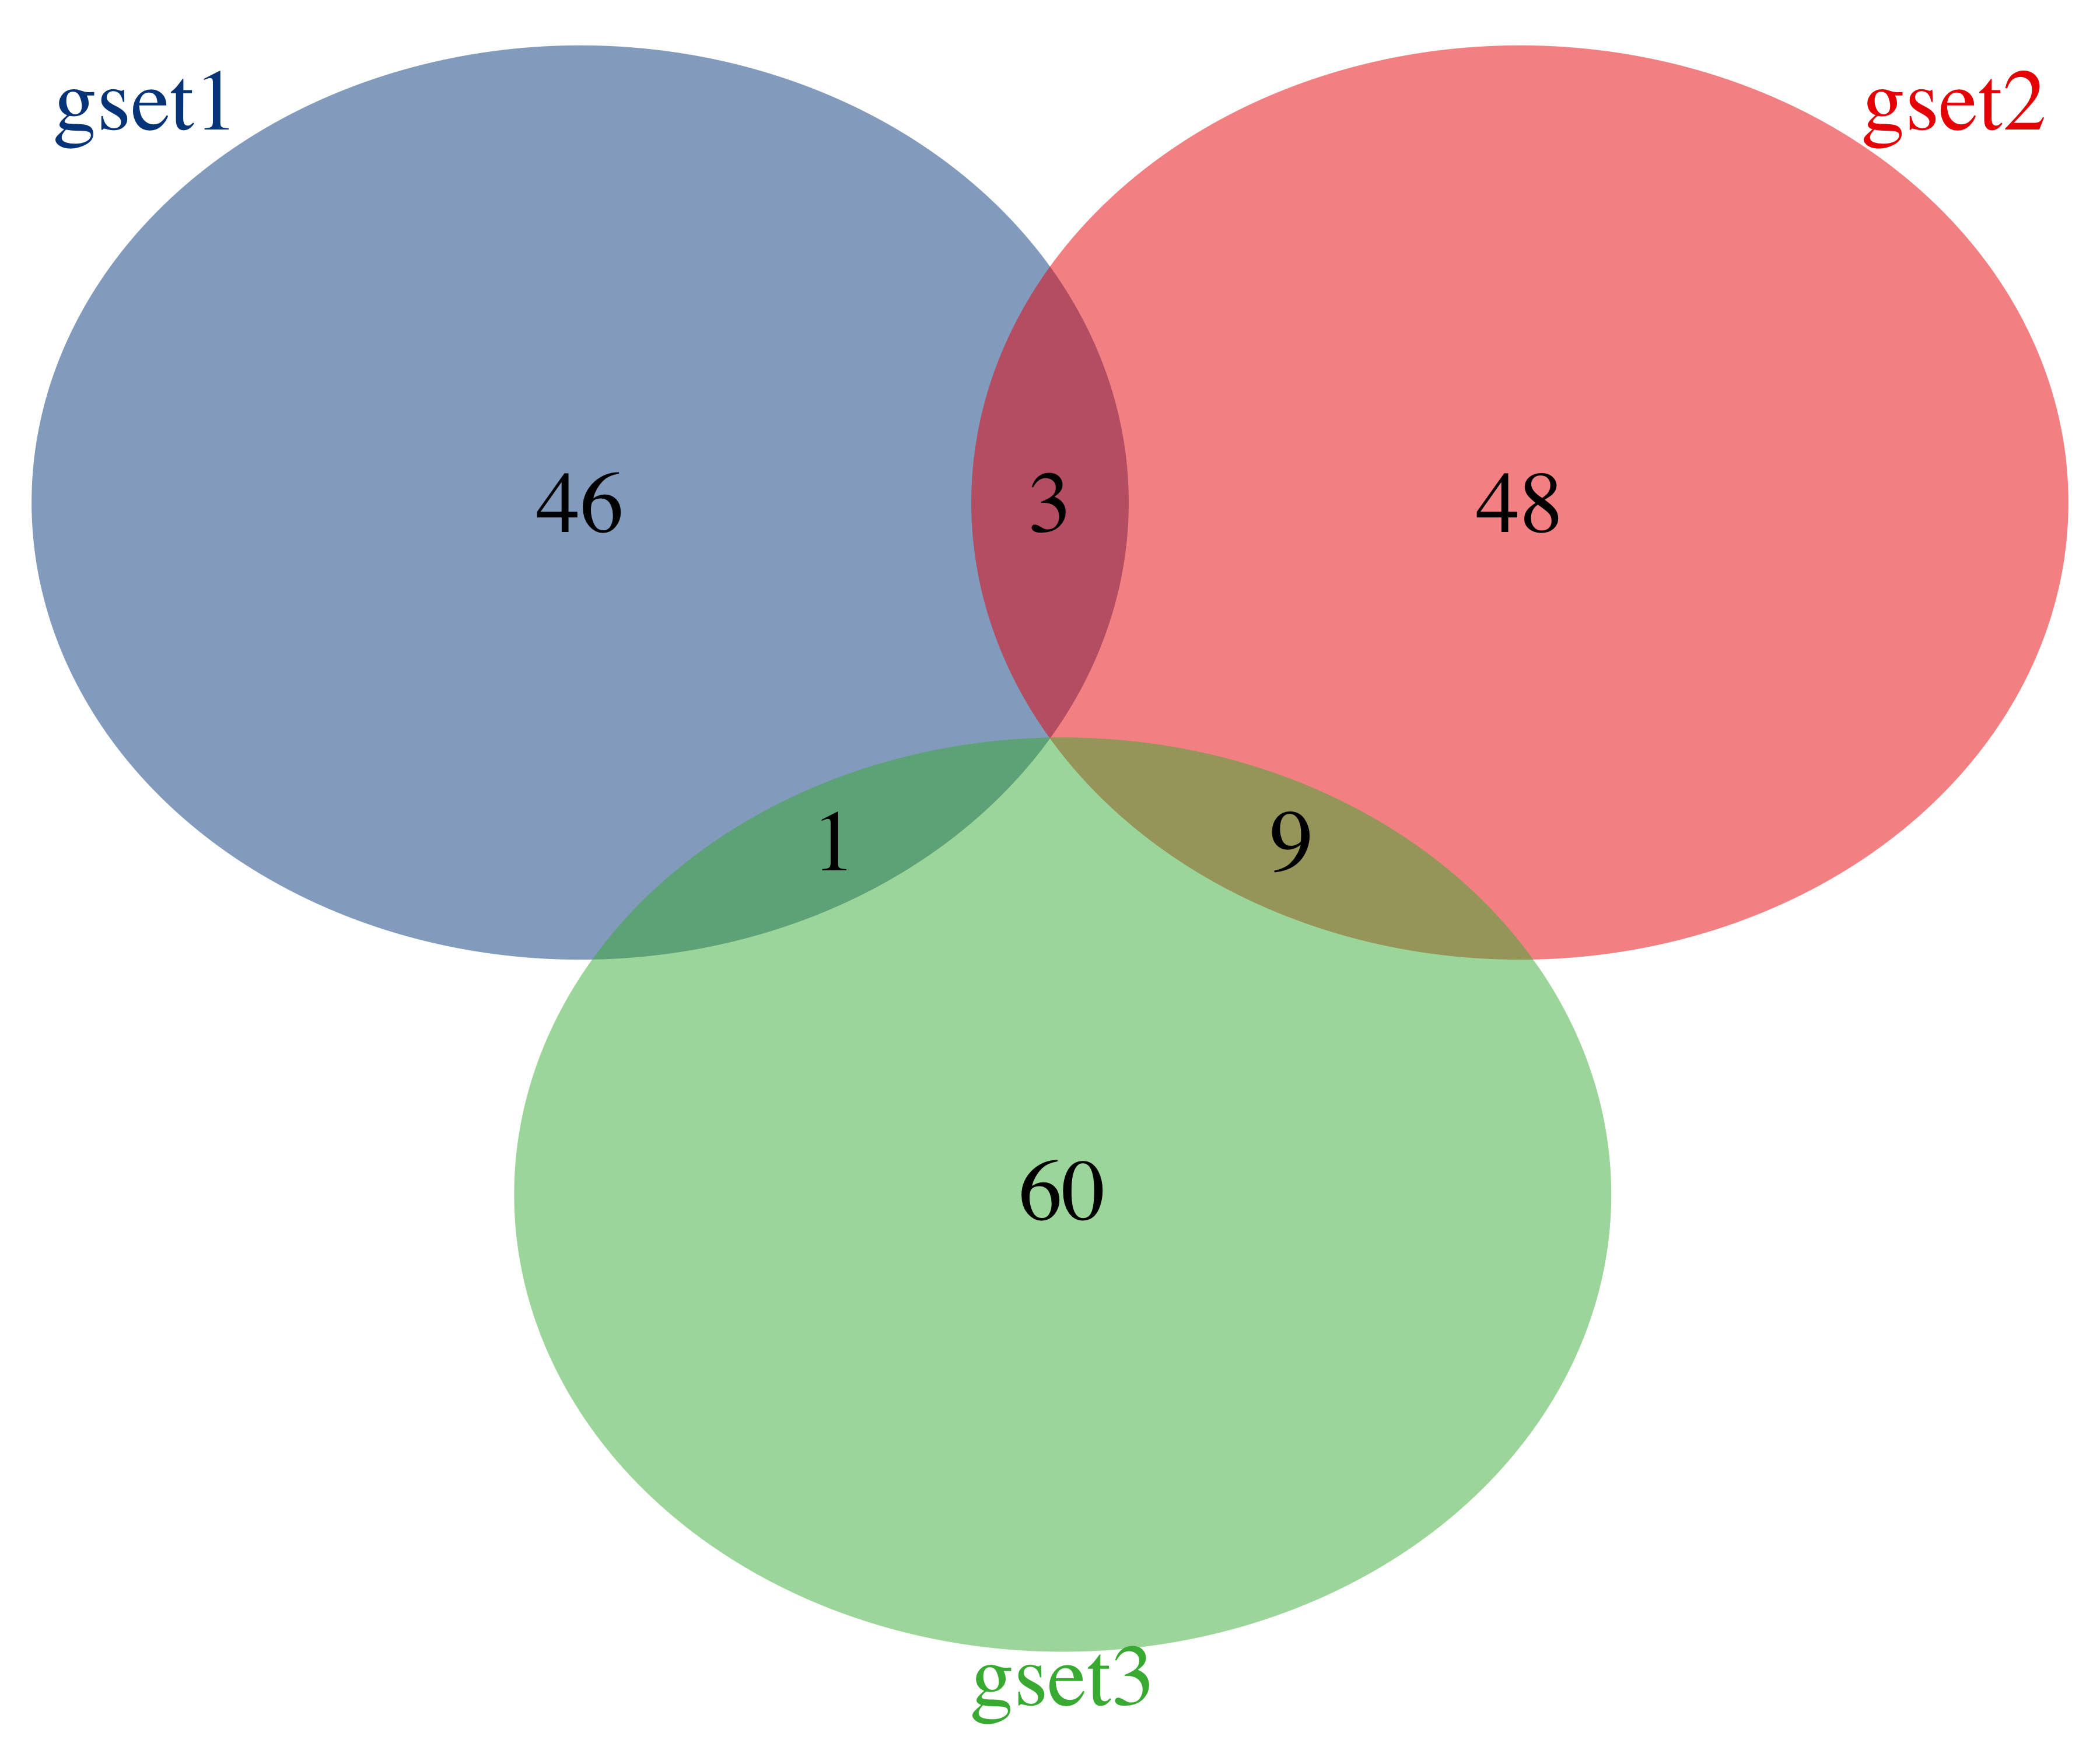
Figure 13.1: Venn plot
UpSet plot is better for over four groups of genes:
plotVenn(la_gene_list,
         use_venn = FALSE,
         main_text_size = 15,
         legend_text_size = 8,
         legend_position = 'left'
)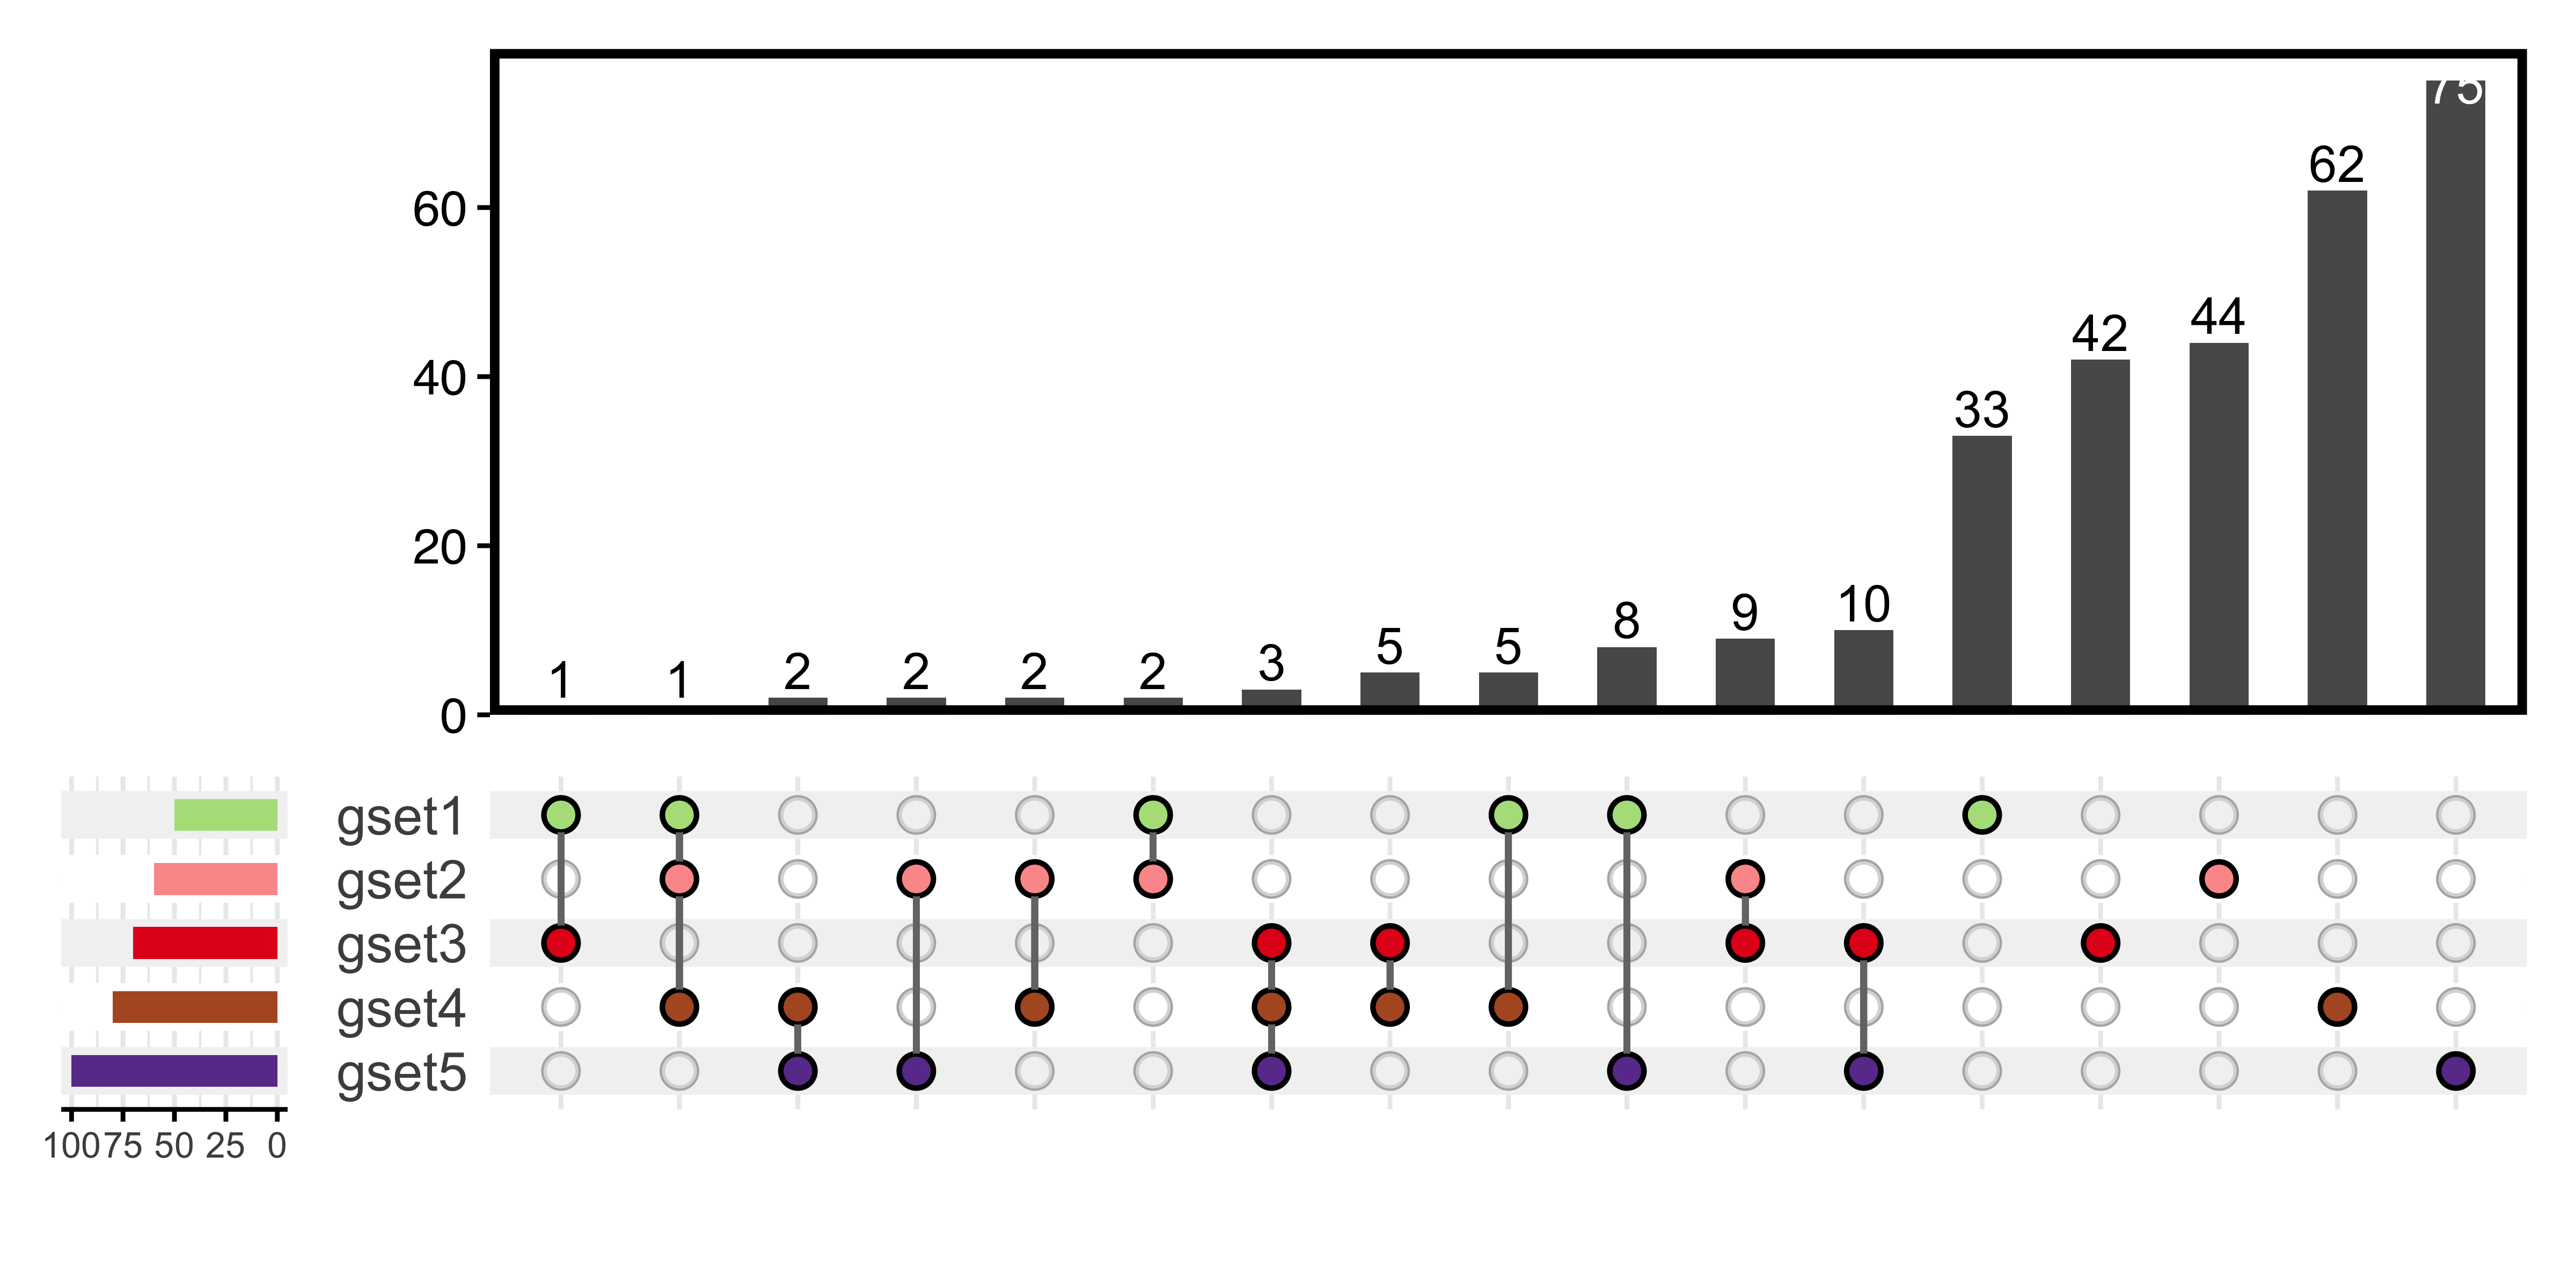
Figure 13.2: UpSet plot
13.2 Volcano Plot
After finishing differential expression analysis, we could get differentially expressed genes (DEG). Volcano plot is widely used for these up/down regulated genes visualization.
The example data is micro array differential expression analysis:
##   probe_id      logFC   AveExpr         t      P.Value   adj.P.Val          B
## 1  8144866  0.5672300  5.761898  6.591099 2.496346e-04 0.002269049  0.3372158
## 2  8066431  0.6526467  9.809843  7.768724 8.554137e-05 0.001045237  1.5161421
## 3  8022674  0.2768667 11.926333  3.958127 4.974269e-03 0.021521339 -2.9321234
## 4  7925531 -0.1321333 11.217700 -1.914468 9.517321e-02 0.198247263 -5.9932047
## 5  8081358  0.3972133  8.994403  4.457386 2.618820e-03 0.013189962 -2.2375610
##   change  entrezid     symbol
## 1 stable        10       NAT2
## 2 stable       100        ADA
## 3 stable      1000       CDH2
## 4 stable     10000       AKT3
## 5 stable 100009676 ZBTB11-AS1
plotVolcano mainly uses a DEG result which should include gene id, fold change and statistic value.
It also has other parameters:
-
stat_metric: choose from “pvalue” and “p.adjust” -
stat_cutoff: cutoff for significant statistic value, default is 0.05 -
logFC_cutoff: cutoff for log2 (fold change), default is 1 which is actually two fold changes -
up_color: color for up-regulated genes -
down_color: color for down-regulated genes -
show_gene: show some gene names, default is none. Suggest renaming the column with these genes as “gene”. -
dot_size: volcano dot size
plotVolcano(deg, "p.adjust", remove_legend = T, dot_size = 3)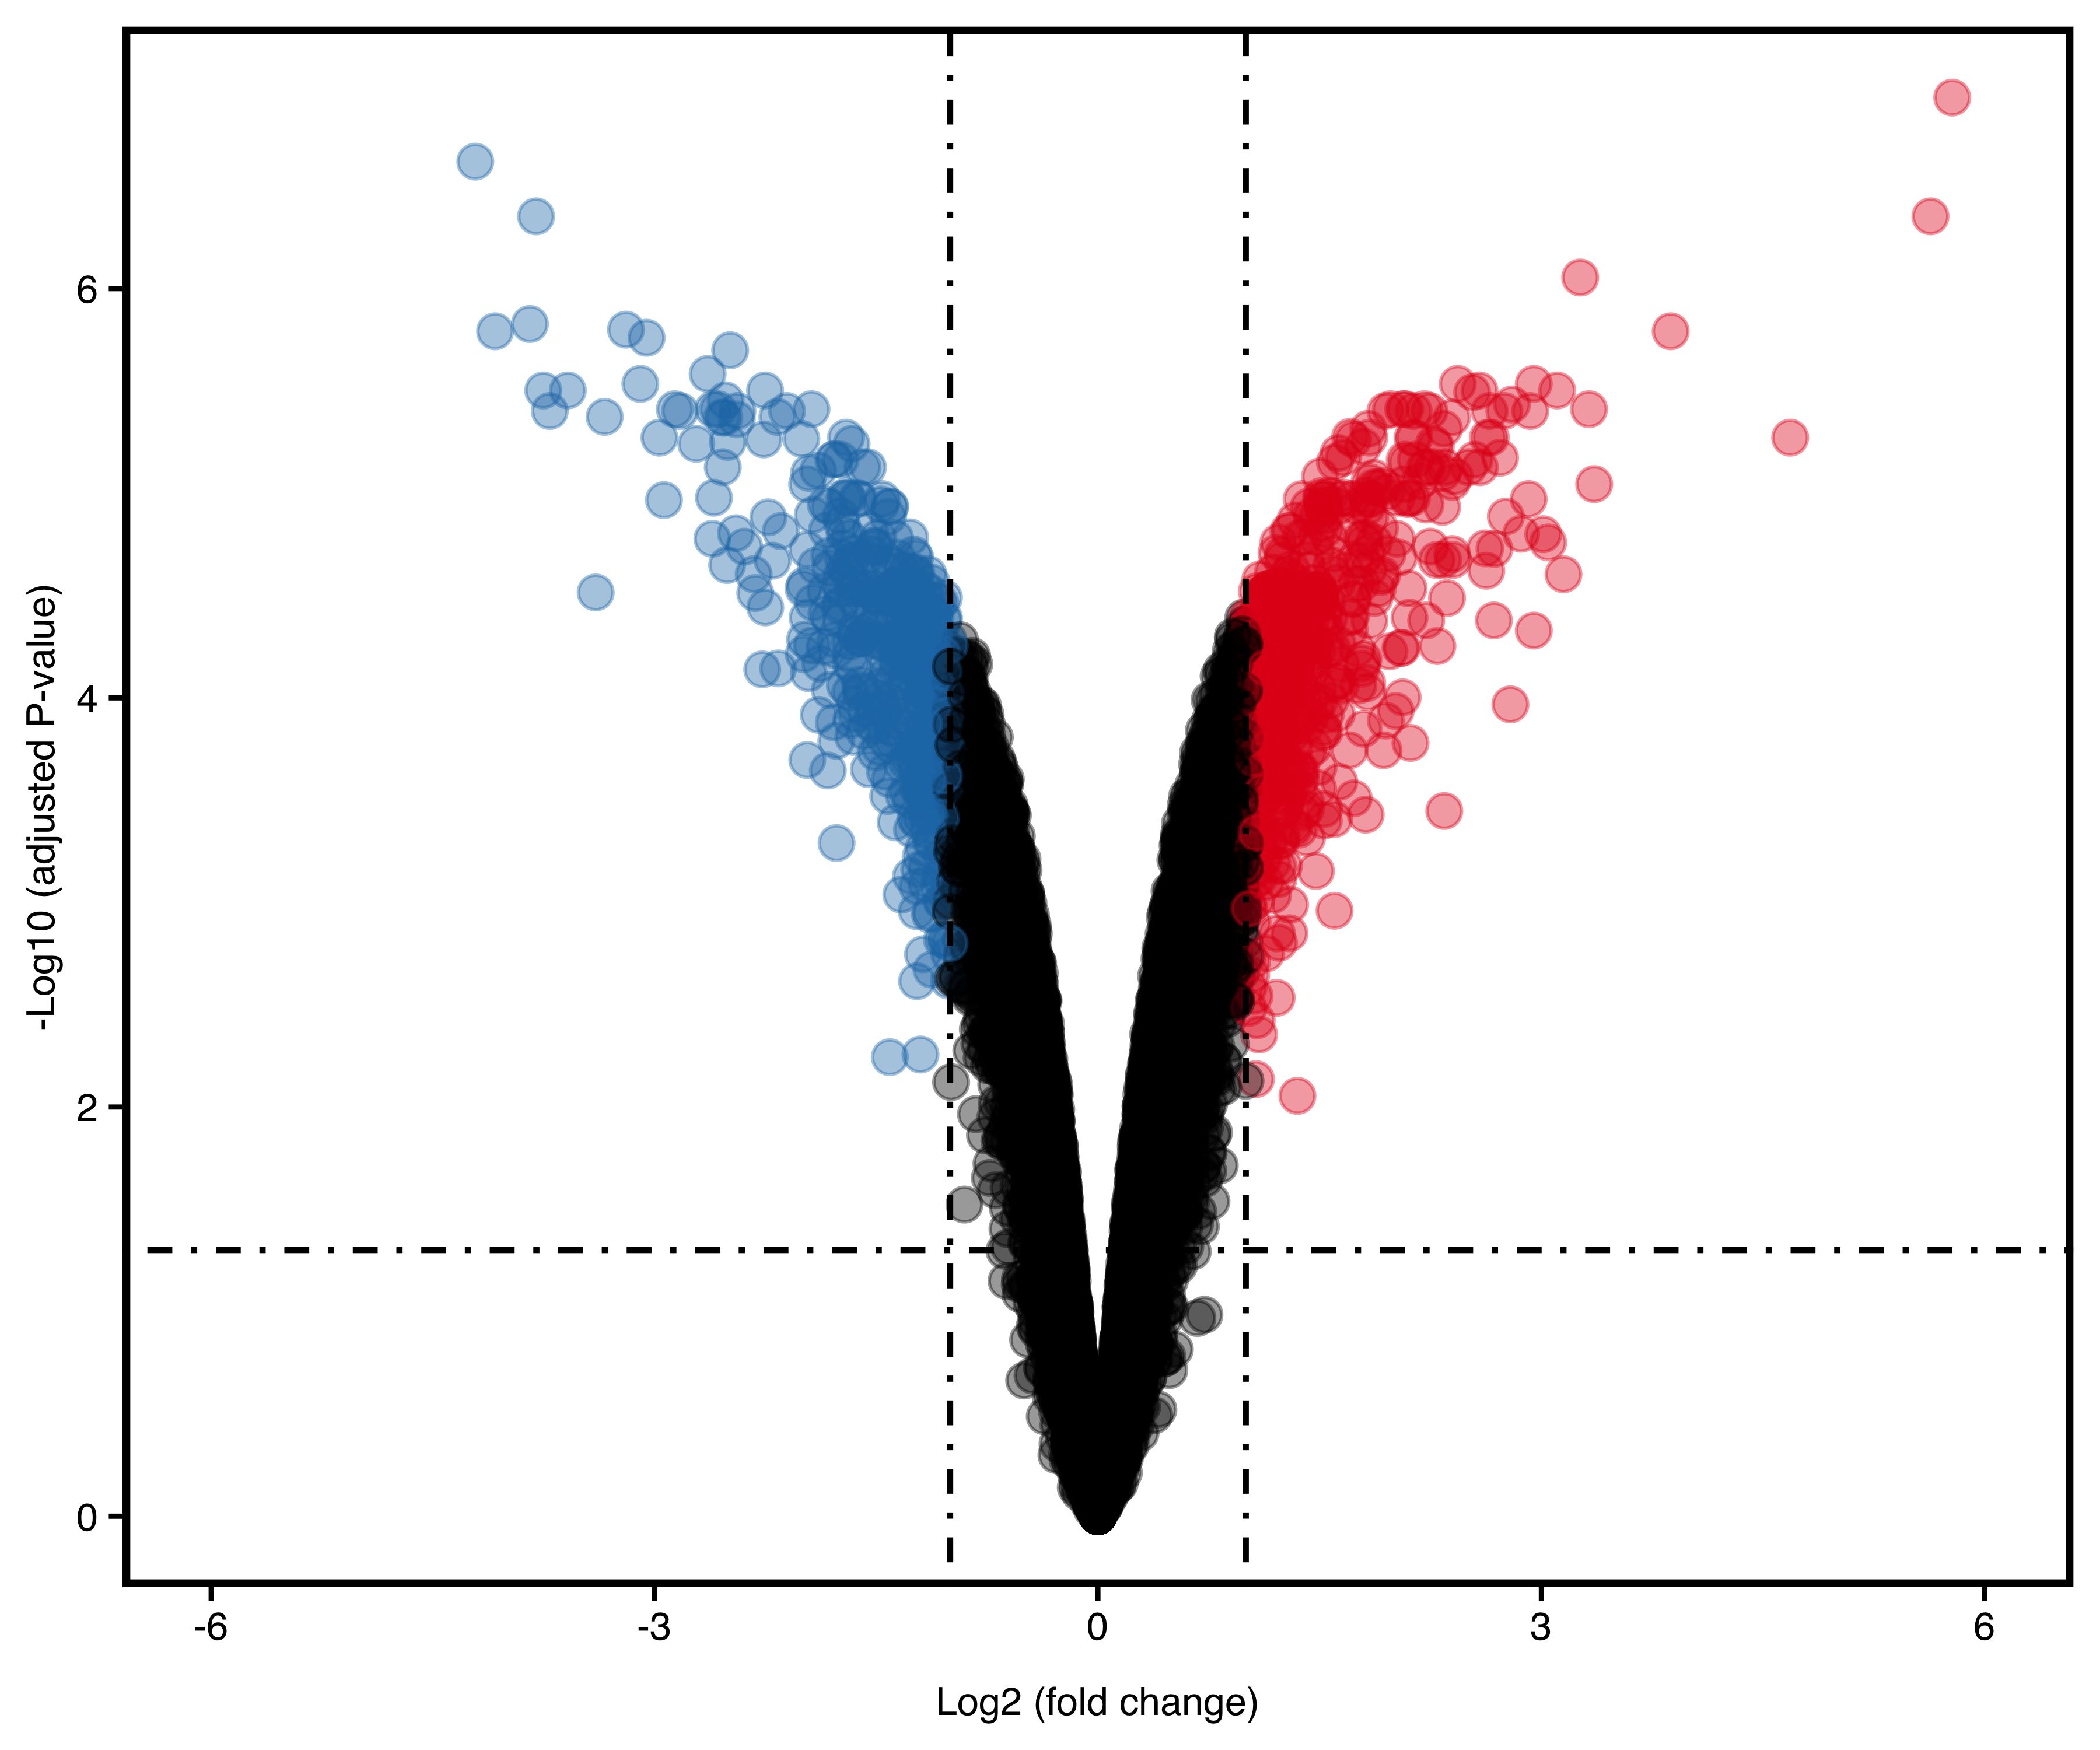
Figure 13.3: Volcano plot
If we want to show some genes:
plotVolcano(deg,
stat_metric = "p.adjust",
remove_legend = T,
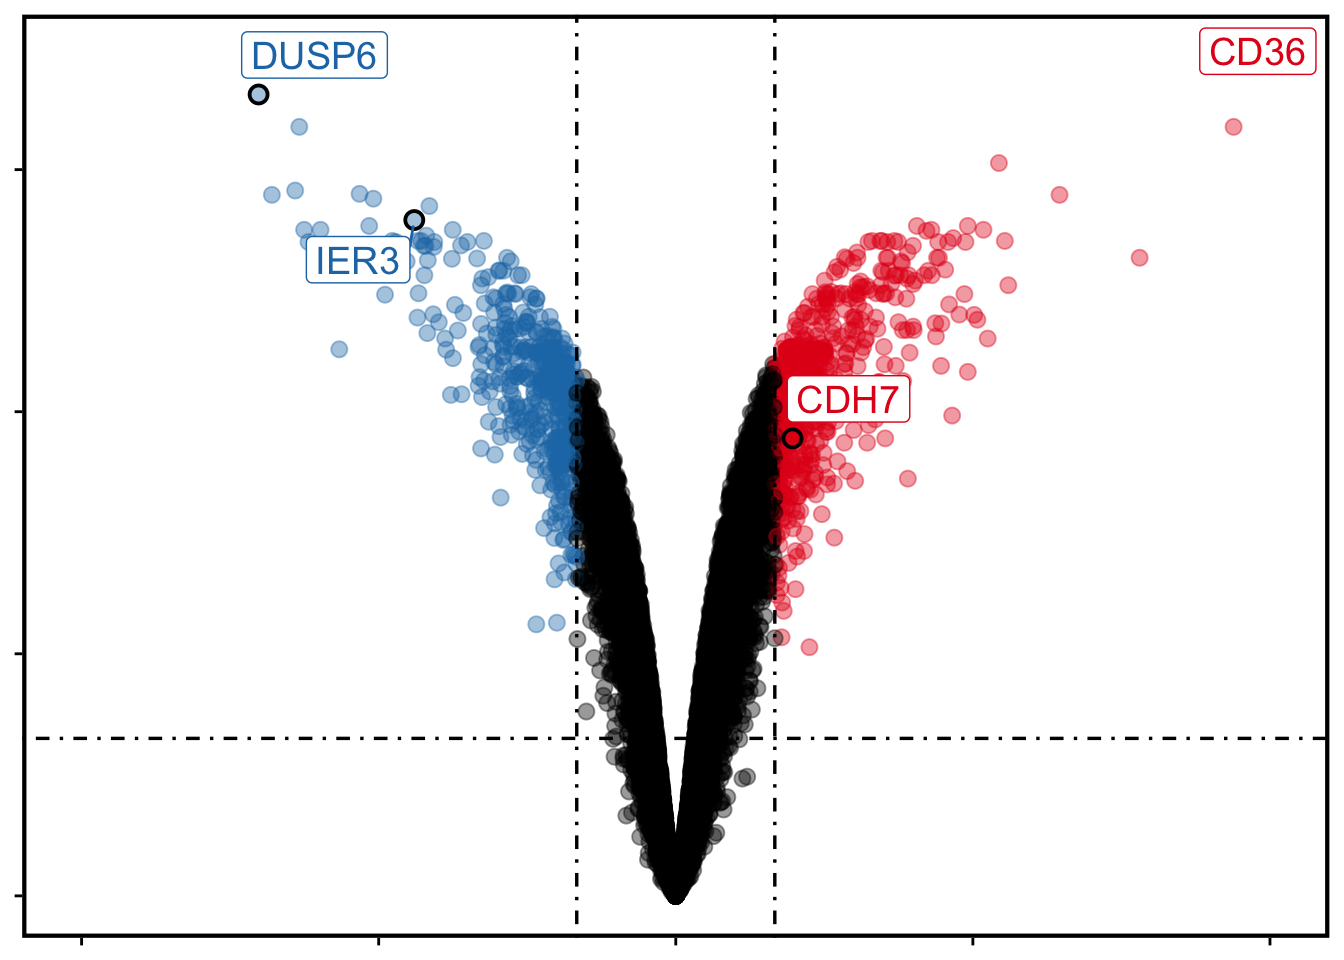
show_gene = c("CD36", "DUSP6", "IER3", "CDH7")
)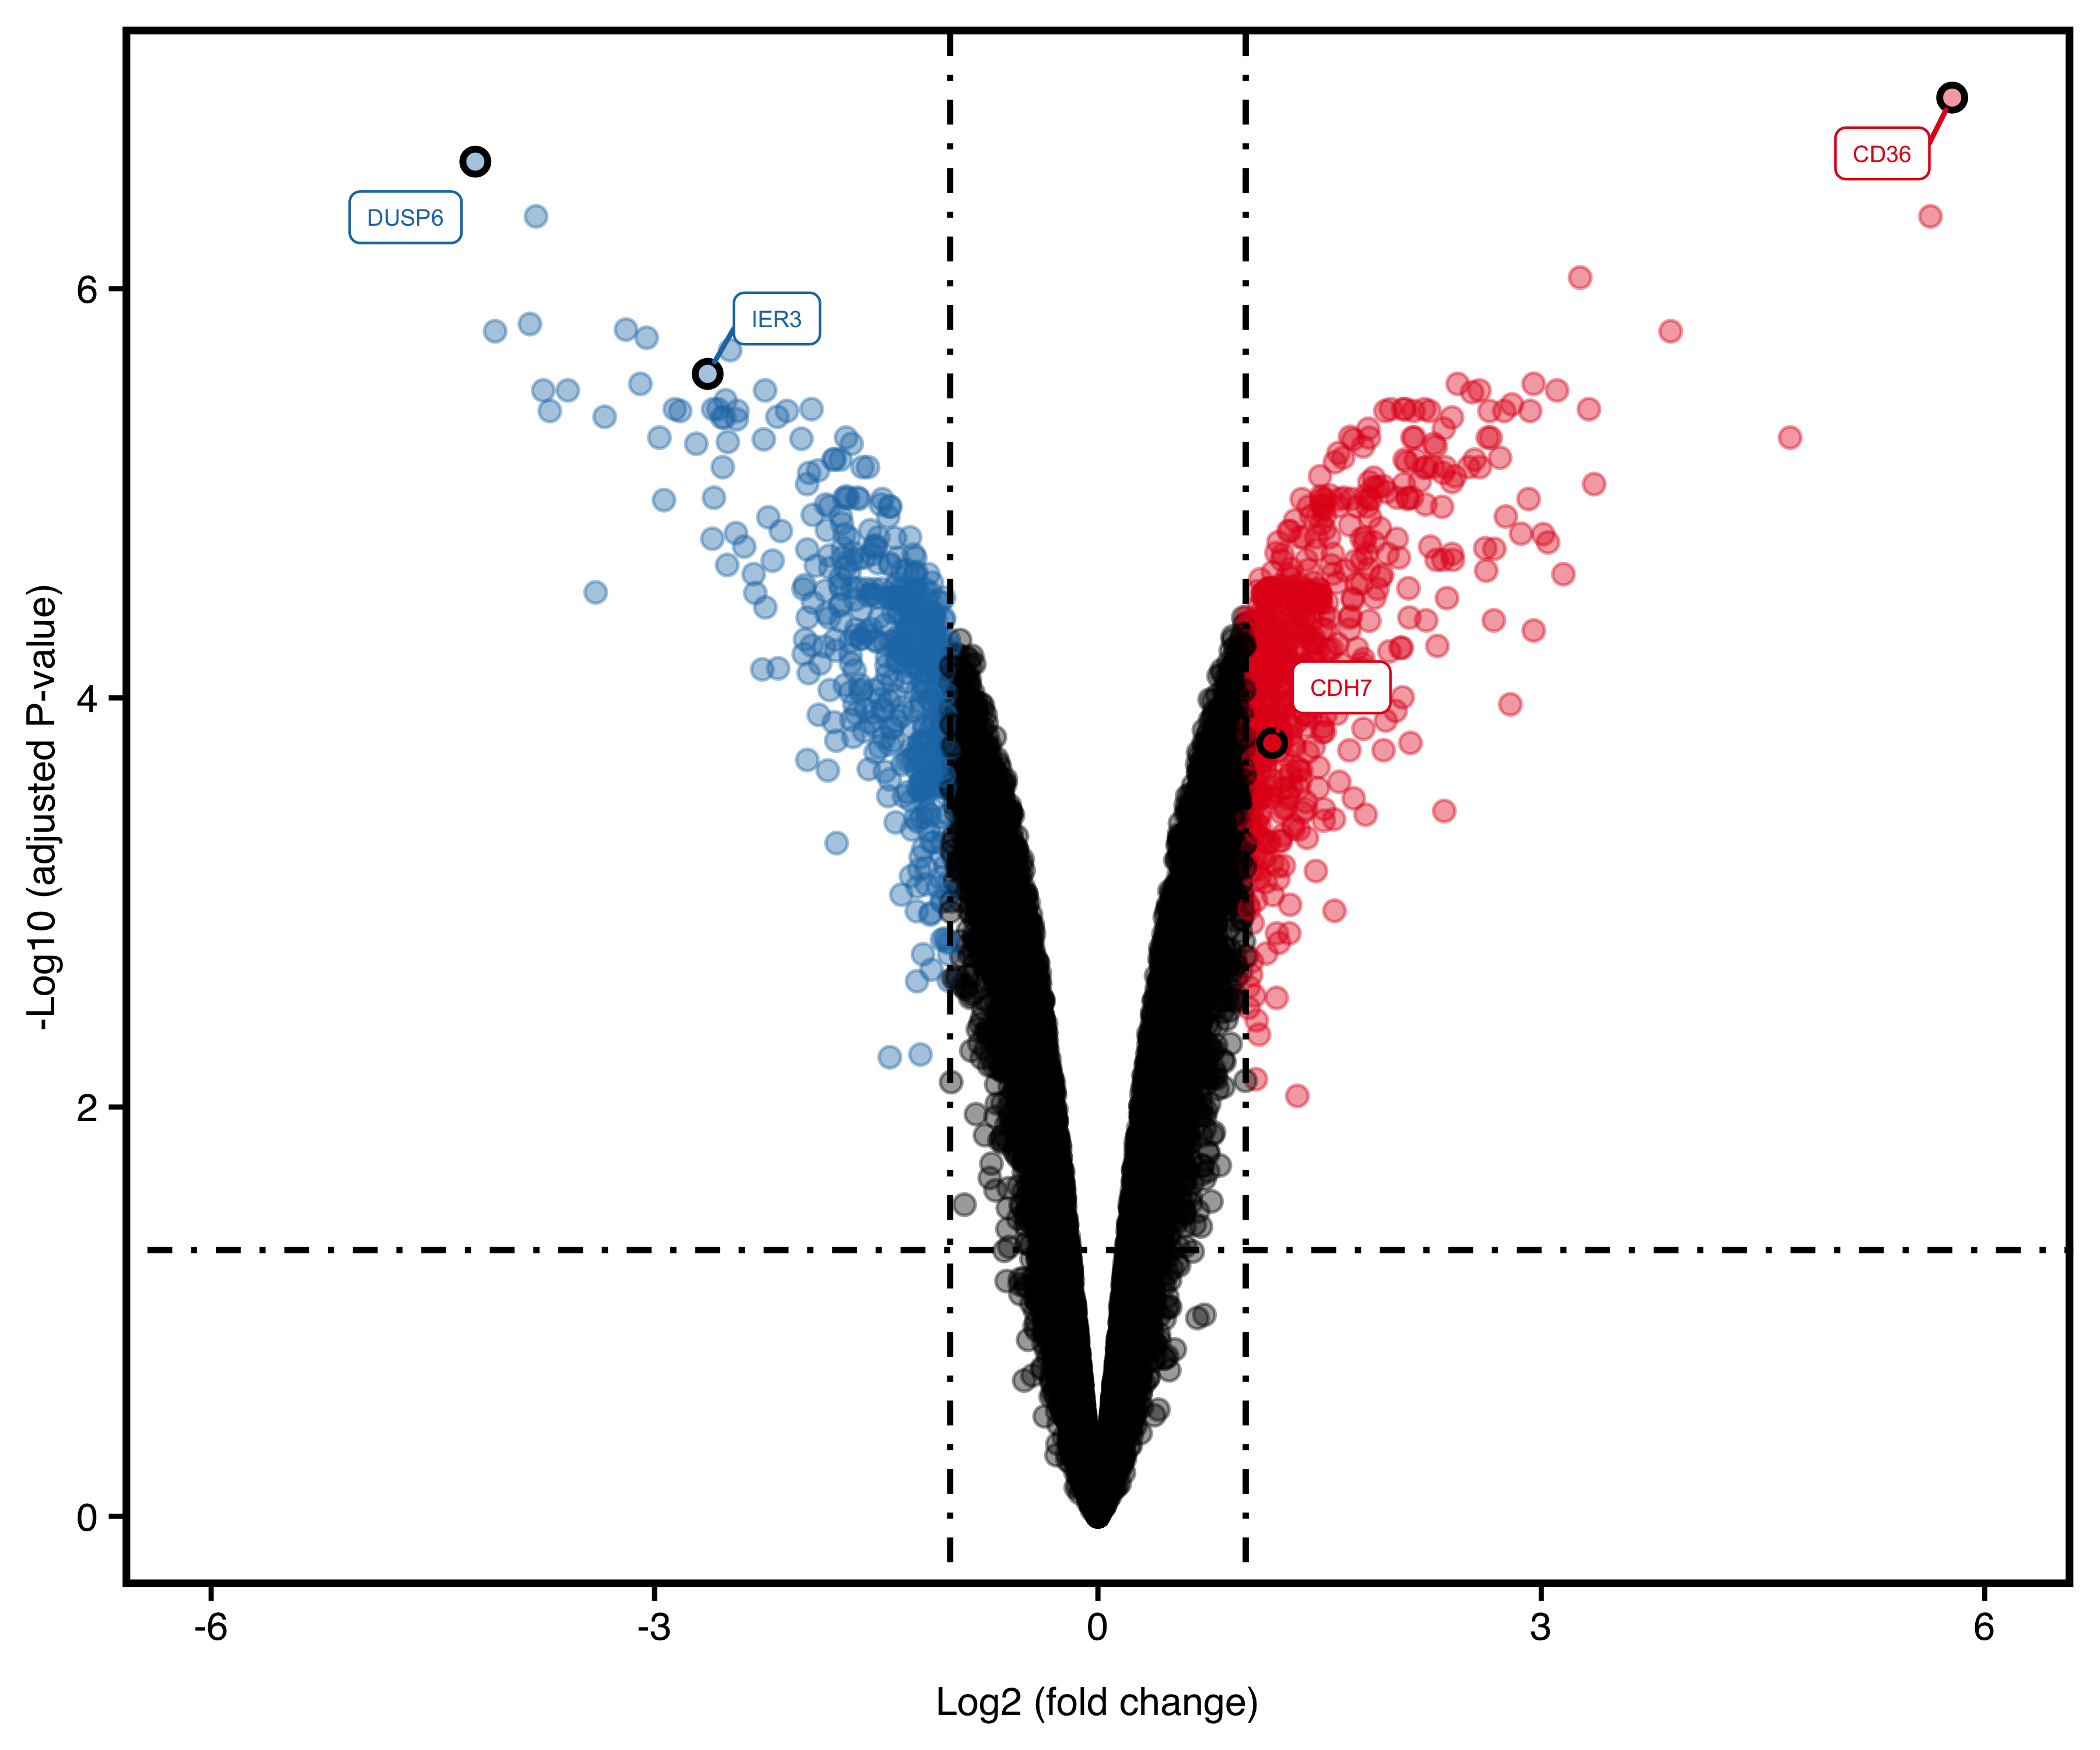
Figure 13.4: Volcano plot with genes.
Trick for increasing text size:
User could hide all x/y-axis labels and raise main_text_size to enlarge gene text, then export the figure into PPT to add labels.
plotVolcano(deg,
            "p.adjust",
            remove_legend = T,
            remove_main_text = T,
            show_gene = c("CD36", "DUSP6", "IER3", "CDH7"),
            main_text_size = 15,
            dot_size = 2.5
)