10 Import external data
10.1 Import GO panther
genekitr::importPanther() support importing panther result from GeneOntology and formatting as genORA result.
Figure 10.1: Import panther result.
For example, we save panther result as “analysis.txt” and pass to importPanther. It will tidy the data and calculate both fold enrichment and rich factor.
panther_res <- importPanther("data/analysis.txt")
head(panther_res, 5)
## ID
## 1 GO:1901295
## 2 GO:0036520
## 3 GO:0036304
## 4 GO:1905066
## 5 GO:0060844
## Description
## 1 regulation of canonical Wnt signaling pathway involved in cardiac muscle cell fate commitment
## 2 astrocyte-dopaminergic neuron signaling
## 3 umbilical cord morphogenesis
## 4 regulation of canonical Wnt signaling pathway involved in heart development
## 5 arterial endothelial cell fate commitment
## GeneRatio BgRatio upload_1 (42) upload_1 (expected)
## 1 0.04761905 9.713925e-05 2 0.00
## 2 0.07142857 1.457089e-04 3 0.01
## 3 0.04761905 9.713925e-05 2 0.00
## 4 0.04761905 9.713925e-05 2 0.00
## 5 0.04761905 9.713925e-05 2 0.00
## upload_1 (over/under) FoldEnrich pvalue qvalue Count RichFactor
## 1 + 490.2143 2.42e-05 9.30e-04 2 9.713925e-05
## 2 + 490.2143 1.56e-07 1.06e-05 3 1.457089e-04
## 3 + 490.2143 2.42e-05 9.28e-04 2 9.713925e-05
## 4 + 490.2143 2.42e-05 9.26e-04 2 9.713925e-05
## 5 + 490.2143 2.42e-05 9.23e-04 2 9.713925e-05Then, you could select interested terms and utilize plot functions on Chapter 11.
For example:
plotEnrich(panther_res[c(50,100,350,580,700),],
           plot_type = "bar",
           stats_metric = "qvalue",
           term_metric = "GeneRatio",
           main_text_size = 13,
           legend_text_size = 10
           )
Figure 10.2: Bar plot of Panther result.
10.2 Import clusterProfiler object
clusterProfiler is a popular R package of enrichment analysis. However, it requires user has some programming skills to operate its S4 object, which may cause inconvenience in data cleaning and visualization.
Here, genekitr::importCP() could easily import the S4 object with additional attributes (e.g. FoldEnrich, RichFactor) to help users communicate with data more fluently.
10.2.1 clusterProfiler ORA-GO result
## example data
library(clusterProfiler)
library(org.Hs.eg.db)
data(geneList, package="DOSE")
gene <- names(geneList)[abs(geneList) > 2]

## GO result from clusterProfiler
go <- enrichGO(gene          = gene,
                OrgDb         = org.Hs.eg.db,
                ont           = "BP",
                pAdjustMethod = "BH",
                pvalueCutoff  = 0.01,
                qvalueCutoff  = 0.05)

isS4(go) # return a S4 object
## [1] TRUE
## import
go_easy <- importCP(go, type = "go")
is.data.frame(go_easy)
## [1] TRUE
# keep the same as the original result
identical(as.data.frame(go)[,1], go_easy[,1])
## [1] TRUE
head(go_easy)## hs_BP_ID Description GeneRatio BgRatio
## GO:0140014 GO:0140014 mitotic nuclear division 0.1752577 286/18866
## GO:0000280 GO:0000280 nuclear division 0.1855670 428/18866
## GO:0048285 GO:0048285 organelle fission 0.1907216 476/18866
## GO:0000070 GO:0000070 mitotic sister chromatid segregation 0.1237113 161/18866
## GO:0000819 GO:0000819 sister chromatid segregation 0.1288660 196/18866
## GO:0007059 GO:0007059 chromosome segregation 0.1494845 334/18866
## pvalue p.adjust qvalue
## GO:0140014 2.171838e-26 6.700119e-23 5.710790e-23
## GO:0000280 1.099719e-22 1.696316e-19 1.445841e-19
## GO:0048285 4.058841e-22 4.173841e-19 3.557538e-19
## GO:0000070 3.322345e-21 2.562358e-18 2.184005e-18
## GO:0000819 2.422383e-20 1.494610e-17 1.273918e-17
## GO:0007059 9.308954e-19 4.786354e-16 4.079608e-16
## geneID
## GO:0140014 55143/991/9493/1062/4605/9133/10403/23397/9787/11065/51203/22974/10460/4751/27338/983/4085/81930/81620/332/3832/7272/64151/9212/1111/9319/9055/3833/146909/6790/891/24137/9232/652
## GO:0000280 55143/991/9493/1062/4605/9133/10403/7153/23397/259266/9787/11065/51203/22974/10460/4751/27338/983/4085/81930/81620/332/3832/7272/64151/9212/1111/9319/9055/3833/146909/6790/891/24137/9232/652
## GO:0048285 55143/991/9493/1062/4605/9133/10403/7153/23397/259266/9787/11065/51203/22974/10460/4751/27338/983/4085/81930/81620/332/3832/7272/64151/9212/1111/9319/9055/3833/146909/6790/891/24137/9232/652/4137
## GO:0000070 55143/991/9493/1062/10403/23397/9787/11065/51203/10460/4751/4085/81930/81620/7272/64151/9212/9319/9055/3833/146909/891/24137/9232
## GO:0000819 55143/991/9493/1062/10403/7153/23397/9787/11065/51203/10460/4751/4085/81930/81620/7272/64151/9212/9319/9055/3833/146909/891/24137/9232
## GO:0007059 55143/991/9493/1062/10403/7153/23397/9787/11065/55355/220134/51203/10460/4751/55839/4085/81930/81620/332/7272/64151/9212/9319/9055/3833/146909/891/24137/9232
## geneID_symbol
## GO:0140014 CDCA8/CDC20/KIF23/CENPE/MYBL2/CCNB2/NDC80/NCAPH/DLGAP5/UBE2C/NUSAP1/TPX2/TACC3/NEK2/UBE2S/CDK1/MAD2L1/KIF18A/CDT1/BIRC5/KIF11/TTK/NCAPG/AURKB/CHEK1/TRIP13/PRC1/KIFC1/KIF18B/AURKA/CCNB1/KIF4A/PTTG1/BMP4
## GO:0000280 CDCA8/CDC20/KIF23/CENPE/MYBL2/CCNB2/NDC80/TOP2A/NCAPH/ASPM/DLGAP5/UBE2C/NUSAP1/TPX2/TACC3/NEK2/UBE2S/CDK1/MAD2L1/KIF18A/CDT1/BIRC5/KIF11/TTK/NCAPG/AURKB/CHEK1/TRIP13/PRC1/KIFC1/KIF18B/AURKA/CCNB1/KIF4A/PTTG1/BMP4
## GO:0048285 CDCA8/CDC20/KIF23/CENPE/MYBL2/CCNB2/NDC80/TOP2A/NCAPH/ASPM/DLGAP5/UBE2C/NUSAP1/TPX2/TACC3/NEK2/UBE2S/CDK1/MAD2L1/KIF18A/CDT1/BIRC5/KIF11/TTK/NCAPG/AURKB/CHEK1/TRIP13/PRC1/KIFC1/KIF18B/AURKA/CCNB1/KIF4A/PTTG1/BMP4/MAPT
## GO:0000070 CDCA8/CDC20/KIF23/CENPE/NDC80/NCAPH/DLGAP5/UBE2C/NUSAP1/TACC3/NEK2/MAD2L1/KIF18A/CDT1/TTK/NCAPG/AURKB/TRIP13/PRC1/KIFC1/KIF18B/CCNB1/KIF4A/PTTG1
## GO:0000819 CDCA8/CDC20/KIF23/CENPE/NDC80/TOP2A/NCAPH/DLGAP5/UBE2C/NUSAP1/TACC3/NEK2/MAD2L1/KIF18A/CDT1/TTK/NCAPG/AURKB/TRIP13/PRC1/KIFC1/KIF18B/CCNB1/KIF4A/PTTG1
## GO:0007059 CDCA8/CDC20/KIF23/CENPE/NDC80/TOP2A/NCAPH/DLGAP5/UBE2C/HJURP/SKA1/NUSAP1/TACC3/NEK2/CENPN/MAD2L1/KIF18A/CDT1/BIRC5/TTK/NCAPG/AURKB/TRIP13/PRC1/KIFC1/KIF18B/CCNB1/KIF4A/PTTG1
## Count FoldEnrich RichFactor
## GO:0140014 34 11.560882 0.11888112
## GO:0000280 36 8.179690 0.08411215
## GO:0048285 37 7.559148 0.07773109
## GO:0000070 24 14.496510 0.14906832
## GO:0000819 25 12.404008 0.12755102
## GO:0007059 29 8.443638 0.08682635Then you could select interested terms and utilize plot functions on Chapter 11.
For example:
plotEnrich(tail(go_easy,20),
           plot_type = "genechord",
           show_gene = c("UBE2C", "CDC20", "NDC80"),
           main_text_size = 10,
           legend_text_size = 10
           )
Figure 10.3: Chord plot of clusterProfiler result.
10.2.2 clusterProfiler GSEA result
data(geneList, package="DOSE")
## GSEA result from clusterProfiler
kk <- gseKEGG(geneList     = geneList,
               organism     = 'hsa',
               minGSSize    = 120,
               pvalueCutoff = 0.05,
               verbose      = FALSE)

## import
kk_easy <- importCP(kk,type = 'gsea')
identical(kk@result[,1], kk_easy$gsea_df[,1])
## [1] TRUEThen you could select interested terms and utilize plot functions on Chapter 12.
For example:
plotGSEA(kk_easy, plot_type = "bar",
         main_text_size = 15)
Figure 10.4: Two-side bar plot of clusterProfiler result.
The IDs in the plot are actually from ID column in kk_easy result. If we want to add more content, just modify the ID column:
kk_easy$gsea_df$ID <- paste(kk_easy$gsea_df$ID, kk_easy$gsea_df$Description,sep = ": ")
plotGSEA(kk_easy, plot_type = "bar",
         main_text_size = 15)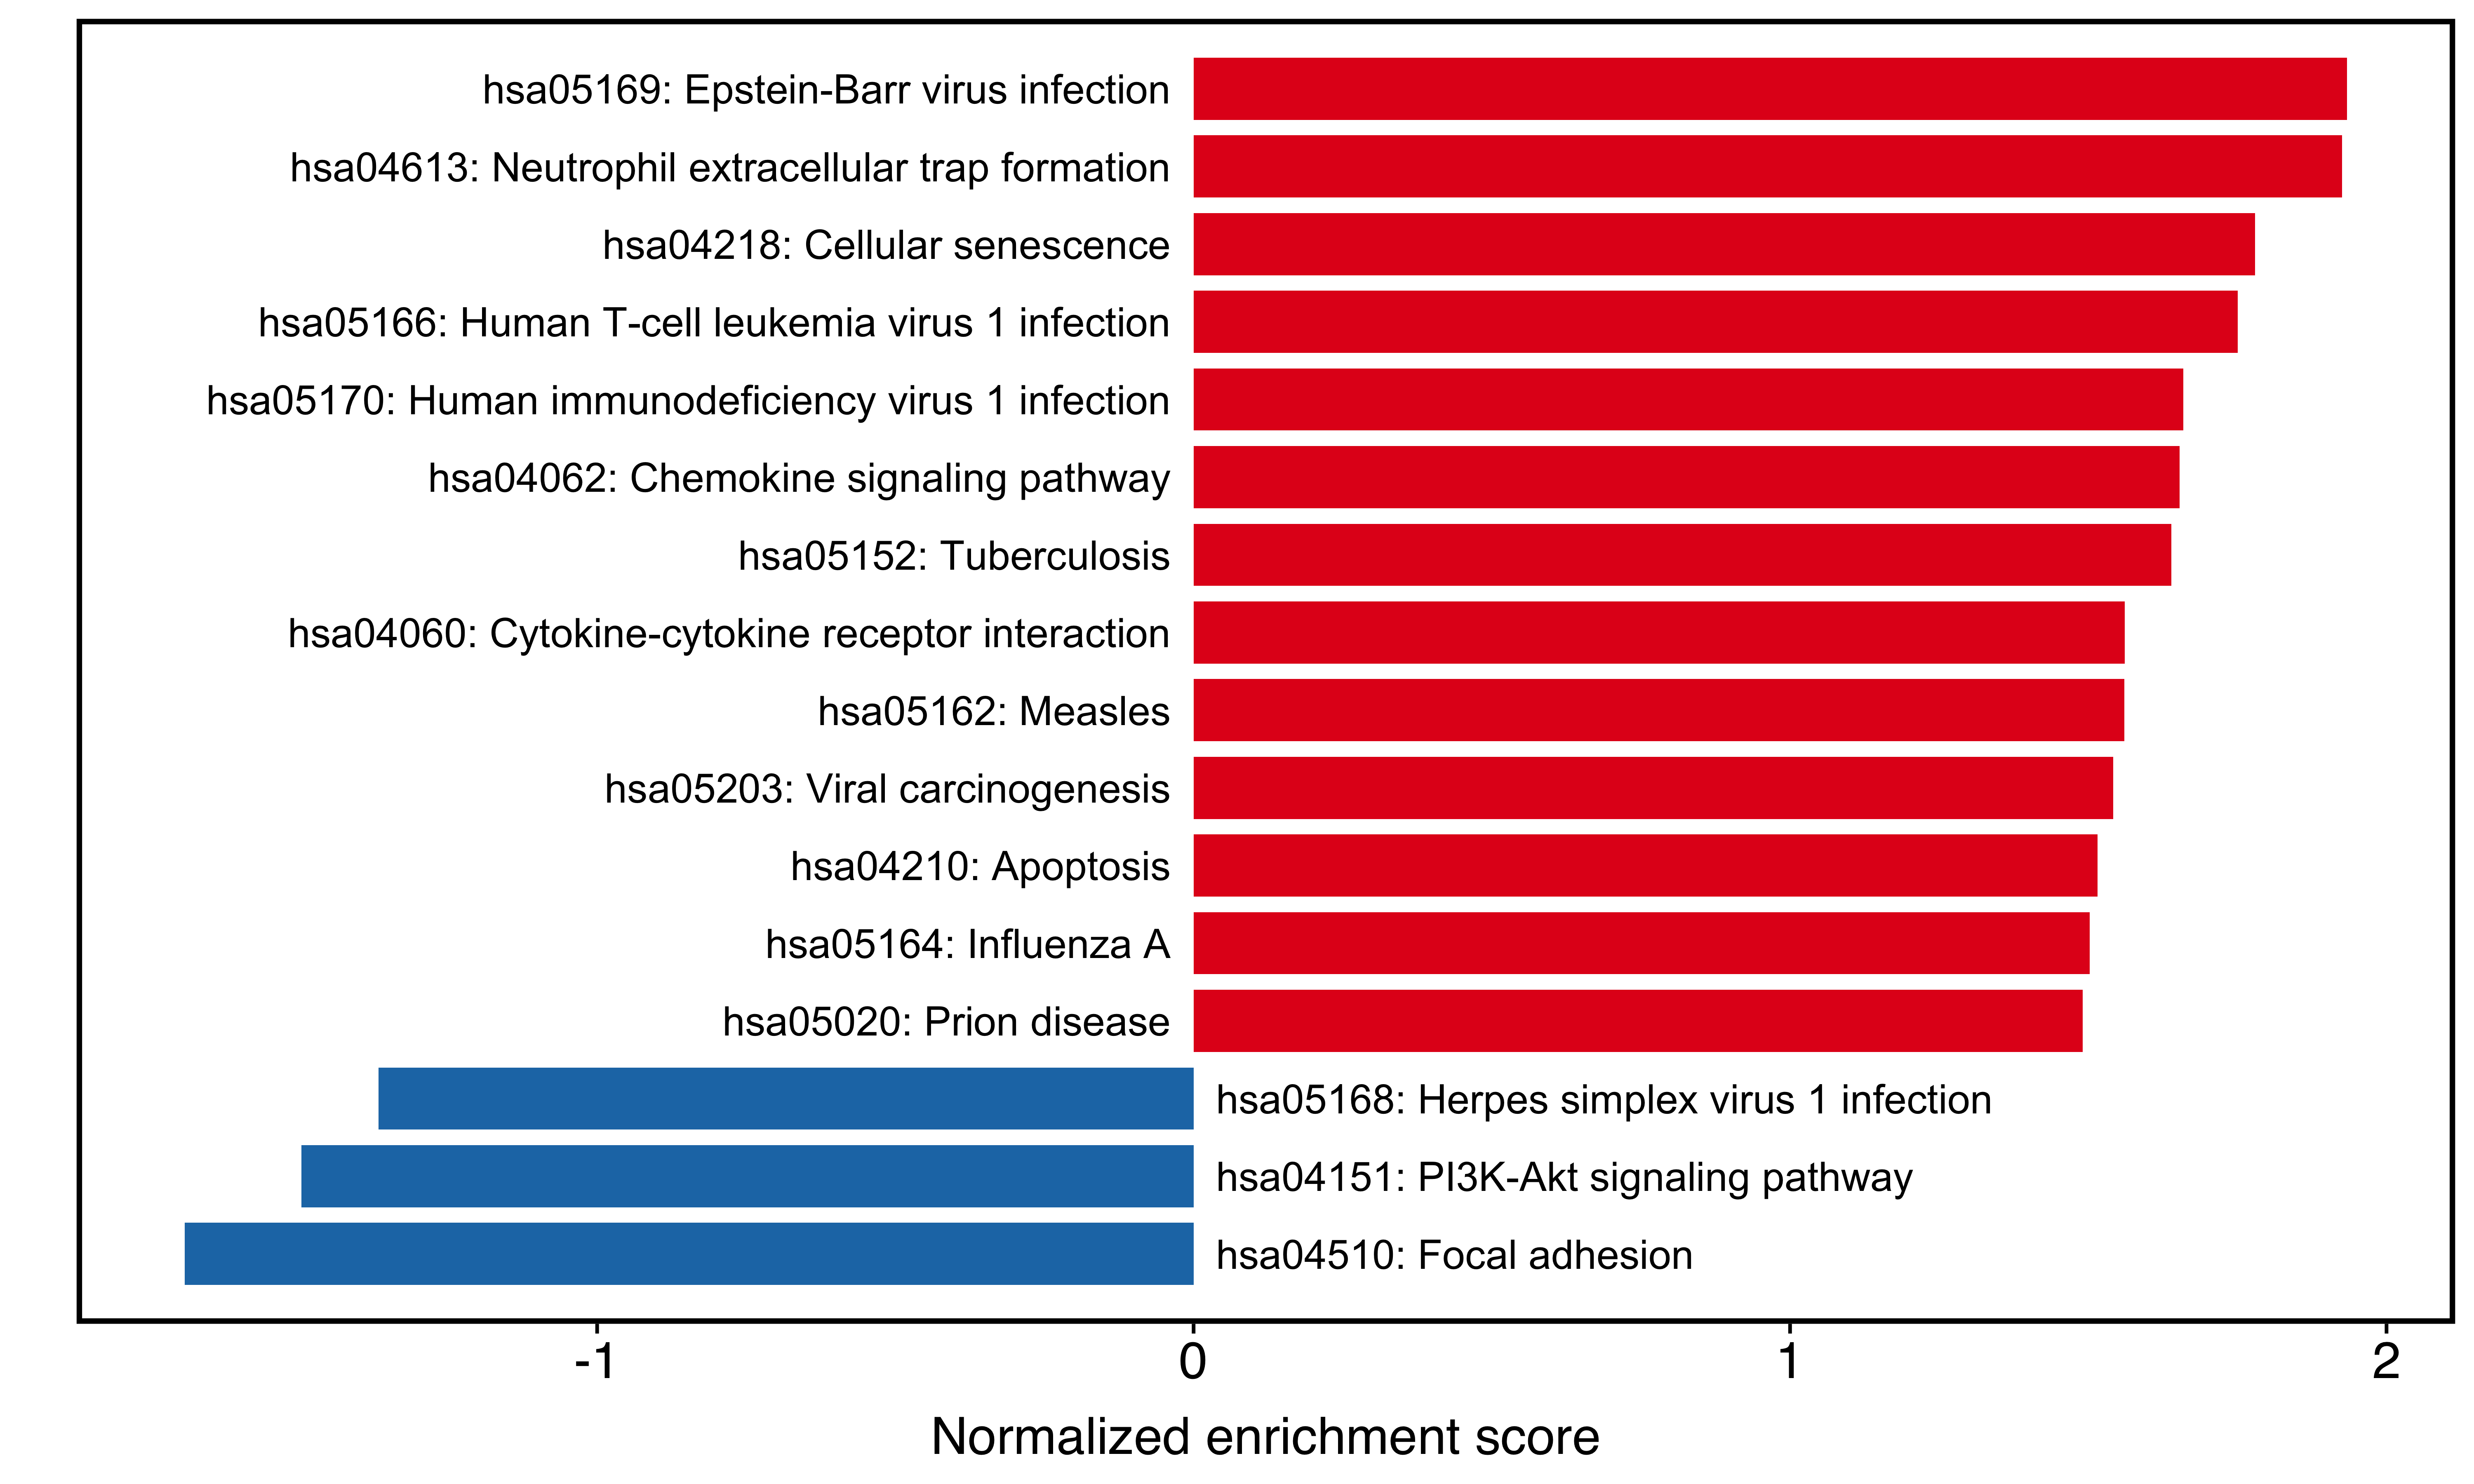
Figure 10.5: Two-side bar plot after modifying labels.
10.2.3 clusterProfiler KEGG/DOSE/WikiPathways… result
clusterProfiler supports many gene sets, including Disease Ontology (DO), WikiPathways, ReactomePA
Take DO as example:
library(DOSE)
data(geneList)
gene <- names(geneList)[abs(geneList) > 1.5]

## ORA-DO result from clusterProfiler
do <- enrichDO(gene          = gene,
              ont           = "DO",
              pvalueCutoff  = 0.05,
              pAdjustMethod = "BH",
              universe      = names(geneList),
              minGSSize     = 5,
              maxGSSize     = 500,
              qvalueCutoff  = 0.05)

# import
do_easy <- importCP(do,type = 'other')
identical(as.data.frame(do)[,1], do_easy[,1])
## [1] TRUEThen you could select interested terms and utilize plot functions on Chapter 11.
For example:
plotEnrich(do_easy,
           plot_type = "geneheat",
           fold_change = geneList,
           show_gene = c('S100A9','AGTR1','BIRC5','MMP1','CXCL10'))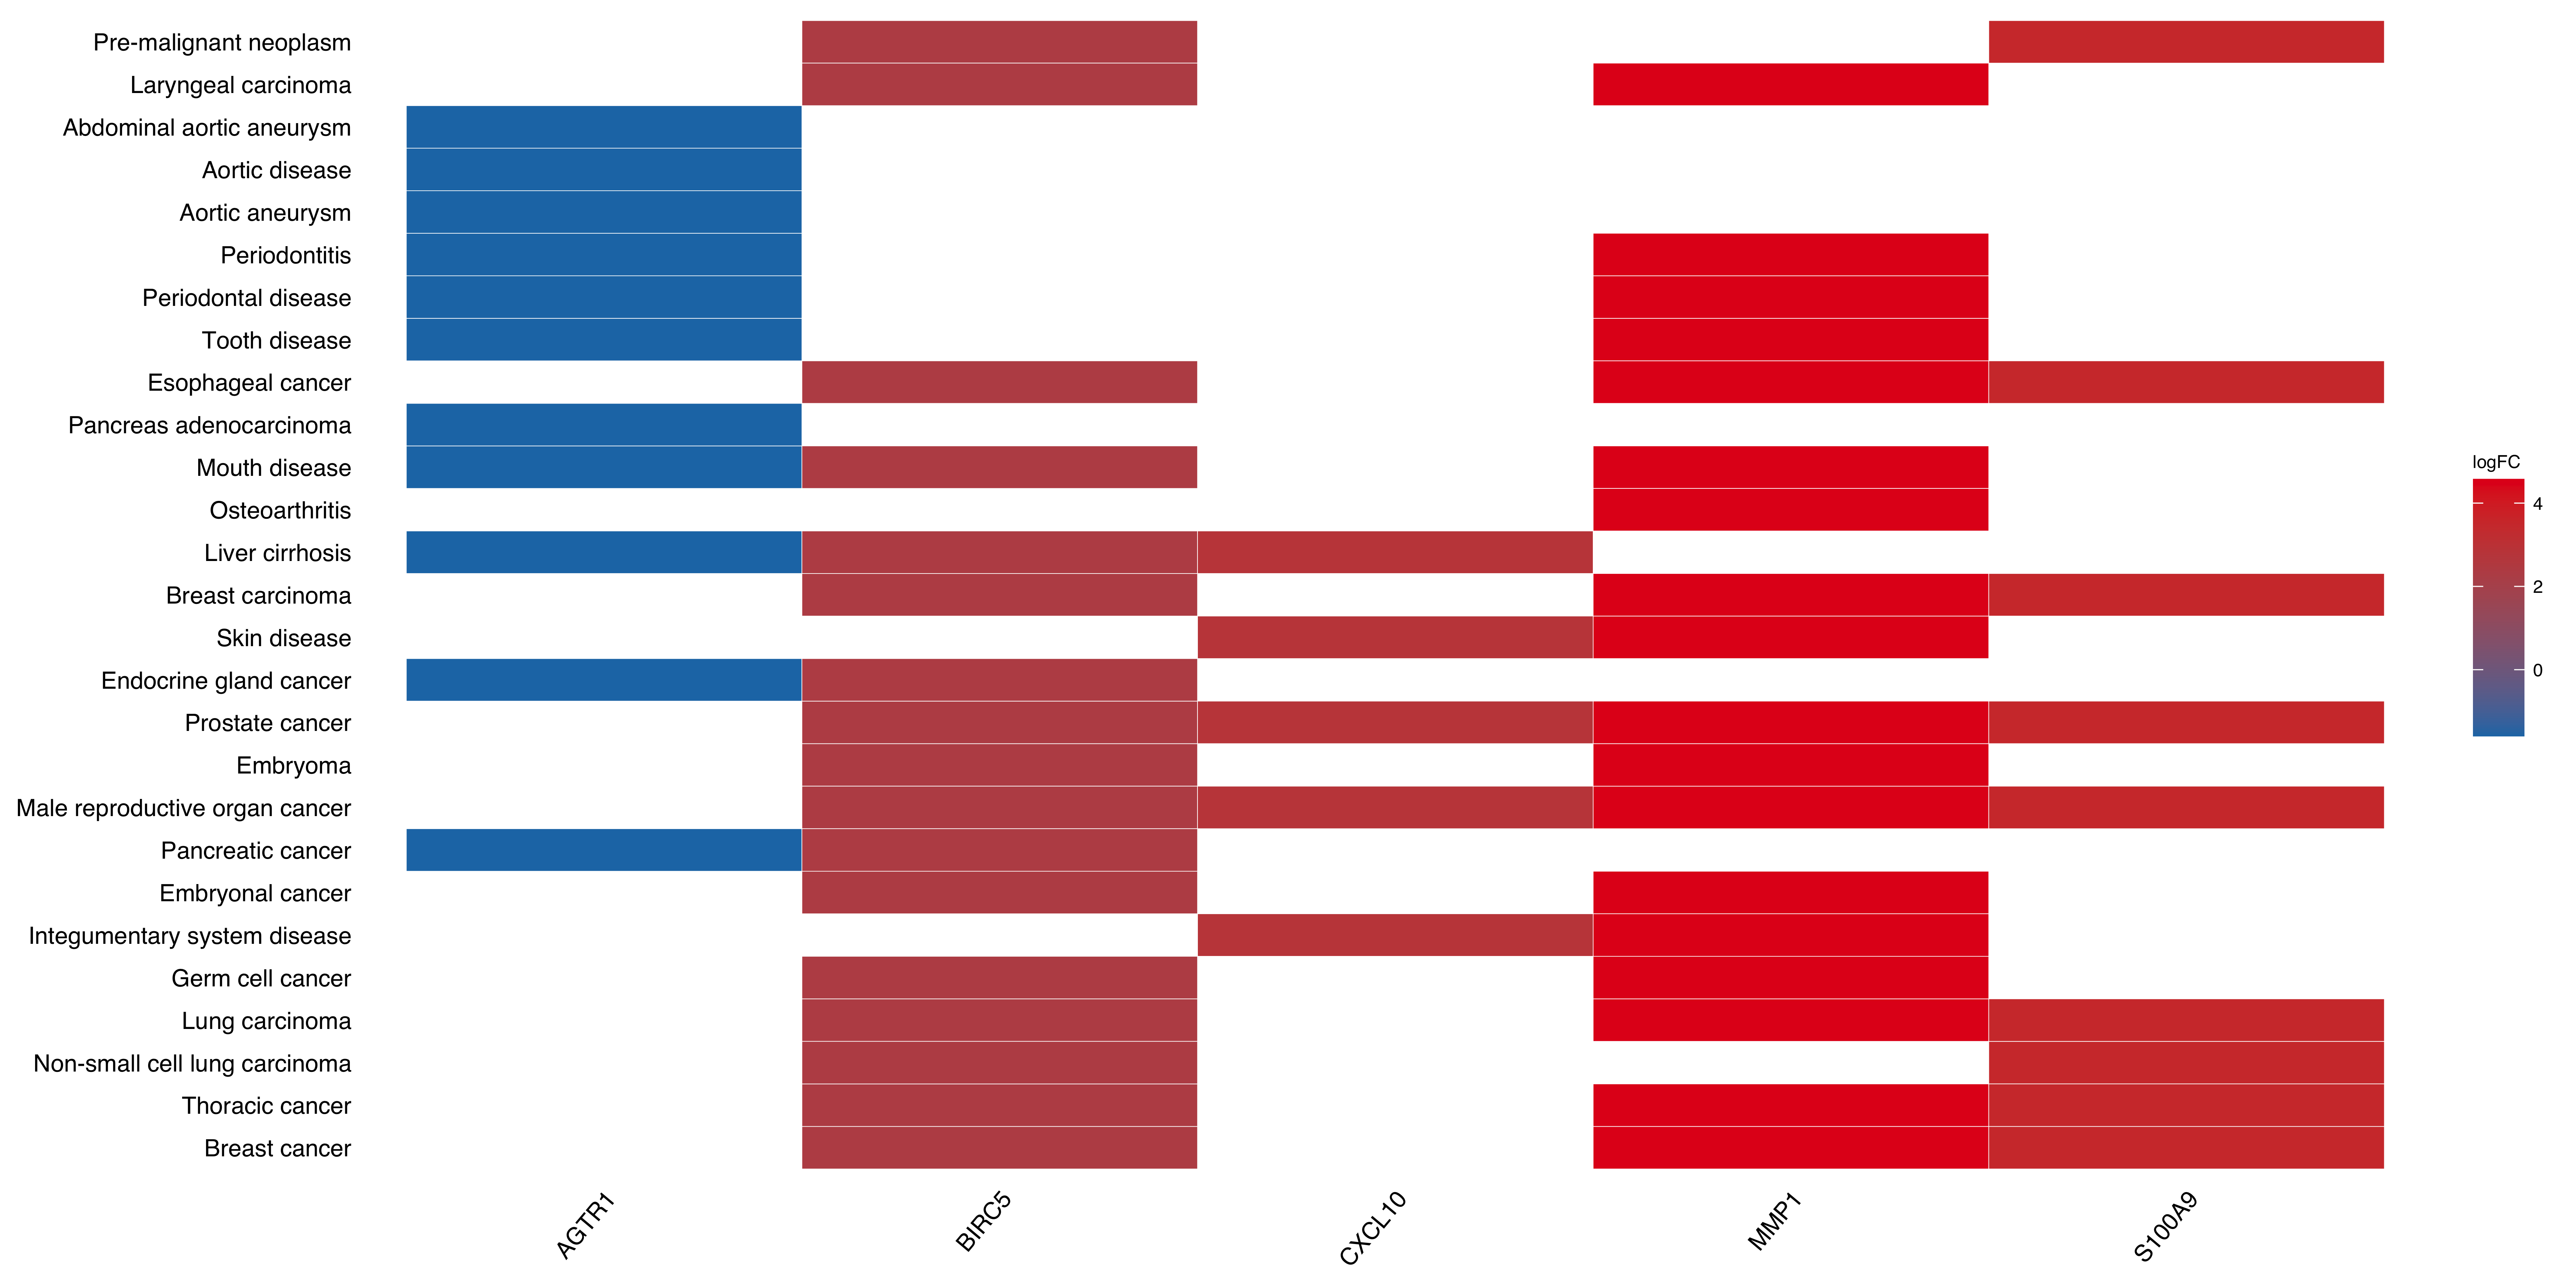
Figure 10.6: Heatmap of clusterProfiler result.